Why Traditional Spectrum Valuation Is Broken
The shift from ownership to deployability

The wireless industry has been valuing spectrum the same way for two decades: auction clearing prices, aggregate MHz-POP ownership, and theoretical capacity. These metrics worked well in an era of abundant capital and patient deployment timelines.
That era is over
In today’s capital-constrained environment, **owning spectrum you cannot afford to deploy is a liability, not an asset.** The market is beginning to separate “spectrum ownership” from “spectrum utility”—and the repricing, when it fully arrives, will be dramatic.
The Fundamental Shift
For most of the past two decades, spectrum functioned as a complementary input to fixed networks. The economic baseline was set by wireline infrastructure, and wireless layered on top. The assumption: more spectrum equals more capacity equals more value.
That hierarchy no longer holds. *Wireless has crossed a threshold where it’s structurally competitive as a last-mile delivery mechanism*—but only under severe capital constraints. Two spectrum portfolios with similar MHz-POP can now produce radically different outcomes depending on deployability, timing, and integration.
What Traditional Metrics Miss
Auction Clearing Prices: Historical artifacts of capital abundance, not current measures of utility. The C-band auction in 2021 cleared at prices that assumed unlimited deployment capital and patient timelines. Neither assumption holds today.
Aggregate Ownership: Owning spectrum you cannot light up creates carry costs without revenue. In a constrained environment, undeployable spectrum becomes a negative-carry asset.
Headline MHz-POP: Ignores propagation characteristics relative to existing tower grid density. A carrier with 400 MHz of mid-band spectrum but no fiber backhaul faces dramatically different economics than one with 200 MHz and extensive metro fiber.
The Deployment Cost Reality
Consider the C-band deployment challenge. Verizon spent $45B+ acquiring C-band spectrum licenses in 2021. But without owned fiber backhaul infrastructure, each incremental site deployment runs an estimated $400-550K (compared to $180-240K for carriers with existing fiber assets).
C-band’s propagation characteristics at 3.7-3.98 GHz require significant network densification—industry estimates suggest 2.5-3.5x current macro grid density depending on market type. This translates to an estimated deployment requirement of $60-80B over 5-7 years, based on infrastructure cost modeling.
The spectrum auction price becomes almost irrelevant when deployment costs dwarf acquisition costs by factors of 1.5-2x.
The Deployability Advantage
T-Mobile’s position illustrates why deployability, not ownership, determines value. They spent $9.34B on selective C-band markets, leveraging their 2.5 GHz holdings from the Sprint merger. The 2.5 GHz band’s favorable propagation characteristics reduce densification requirements.
Combined with inherited Sprint metro fiber assets, their estimated deployment cost per incremental site is substantially lower—giving them a 60% cost advantage per site despite holding ~50% less aggregate MHz-POP than Verizon.
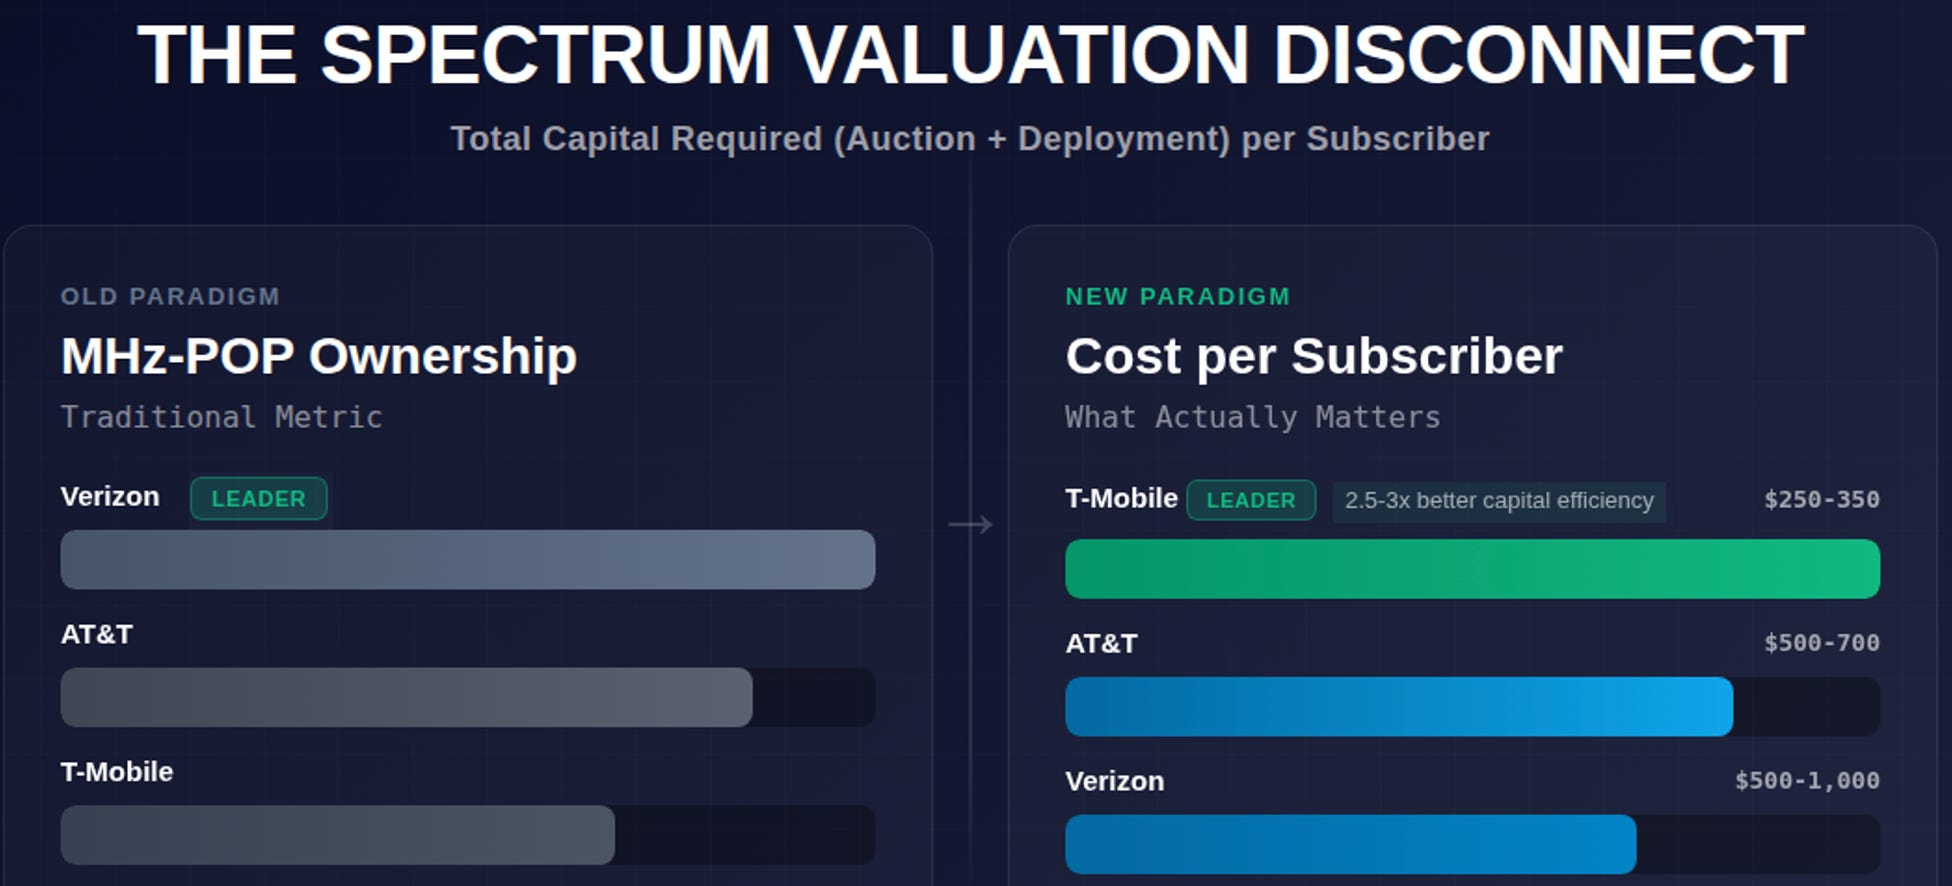
The Metric That Actually Matters
Total Capital Required (Auction + Deployment) per Subscriber Served.
Illustrative estimates based on publicly disclosed data:
• Verizon: Est. $750-1,000 per subscriber
• AT&T: Est. $500-700 per subscriber
• T-Mobile: Est. $250-350 per subscriber (leveraging 2.5 GHz efficiency)
Why This Changes Everything
The Blind Spot: Confusing theoretical capacity with realized capacity. If a carrier can’t afford the densification and doesn’t have (or can’t cheaply obtain) the backhaul to support additional sites, then the spectrum’s “value” is discounted—sometimes harshly—because it’s not deployable at acceptable cost and timeline.
Timing Risk: The repricing doesn’t wait for theoretical capacity limits; it shows up when the build meets the constraint. Deployability isn’t a continuous variable—it arrives in discrete, expensive steps: new site layers, transport upgrades, permitting cycles, integration lag, and vendor/labor bottlenecks.
This means the “value” of a spectrum position is *path-dependent*: the same holdings can be either a near-term advantage or a multi-year capital trap depending on how quickly (and affordably) the network can densify and backhaul.
The Market’s New Logic
The market is beginning to separate ownership from utility. Large positions can compress in valuation because they carry the cost of deployment without guaranteeing deployability. Conversely, balanced positions with strong integration can outperform richer holdings because they clear the constraint with fewer incremental sites and lower transport friction.
This explains three phenomena that confuse traditional spectrum analysis:
• Why large spectrum positions can reprice downward despite scale
• Why non-traditional holdings gain option value in constrained environments
• Why “cheap” spectrum assets can stay cheap longer than expected
The Spectrum Deployability Scorecard™ Framework
This is why we developed The Spectrum Deployability Scorecard™. A framework that scores spectrum portfolios not on what they own, but on what they can actually deploy under capital and time constraints.
Our proprietary analysis incorporates:
• Fiber ownership percentages by metro area
• Propagation-adjusted densification requirements
• Site deployment cost models by carrier and market type
• Capital availability and allocation patterns
• Vendor capacity and labor bottleneck timing
The scorecard doesn’t just identify who has the advantage—it quantifies *when* that advantage materializes and *how much* it’s worth in terms of deployable capacity per dollar of total capital (acquisition + deployment).
What This Means for Investors
Traditional spectrum valuation models are pricing assets that existed in 2020. They’re not pricing the deployment reality of 2026.
The repricing will be sharp when it arrives because the market still treats MHz-POP as the primary metric. Understanding *which* carriers have deployability advantages—and *how large* those advantages are—is no longer optional analysis.
It’s the difference between owning an undervalued asset and holding a capital trap.
Our full Spectrum Deployability Scorecard™Analysis includes:
• Detailed deployability scores for all major US carriers
• Market-by-market fiber ownership analysis
• Proprietary cost-per-deployable-site models
• Capital efficiency rankings and timeline projections
• Valuation framework that integrates deployment constraints
To purchase a copy of our detailed Spectrum Scorecard Valuation Report, follow this link.